
|
Navigate:VIRTUAL EXPLORATIONS > ARCHIVED EXPLORATIONS > AXIAL SEAMOUNT ERUPTION RESPONSE
|
Part 14: Making Lava MapsGuest Contributor: Rachel Teasdale
Posted August 26, 2015: To make a map of a volcano or other feature above sea level can be done using direct observations and Global Positioning System (GPS) to record geologic features directly on a base map. Unfortunately, it’s not so easy at sea, where neither light nor satellite communications penetrate the deep ocean. Even the strong lights of the ROV Jason only penetrate 32 to 64 feet (10-20 m). Instead, sound waves, which are transmitted through water, are used for mapping the bathymetry of the ocean floor. Bathymetric maps show the depth to the seafloor and at Axial Seamount they reveal the caldera, Axial’s rift zones and other topographic features. Bathymetry is represented using color coding to distinguish high areas (shallow depths in warm colors) from low areas (deeper depths in cool colors). This “underwater topography” is similar to a map used to find ones way along a hiking trail, but shows the topography of the seafloor instead. However, the resolution of bathymetric maps depends on how close to the seafloor the sonar data are collected. Sonars on ships can map about at 30-m resolution at this depth (1500 m), whereas sonars on underwater vehicles, which can “fly” much closer to the seafloor, can map at 1-m resolution. A high-resolution map is like focusing a blurry picture – it allows you to see much more detail. As noted in the previous AUV Sentry blog , Sentry uses its multibeam sonar to map the seafloor using a pre-programmed set of tracks that have it systematically fly over the floor of the caldera in an overlapping zig-zag pattern, like “mowing the lawn,” with each strip overlapping the next for thorough coverage. Once AUV Sentry returns to the ship, data from the mapping survey is processed to build bathymetric maps. To convert data into the maps, Jenny Paduan of the Monterey Bay Aquarium Research Institute (MBARI) processes the data to remove tides and other navigational effects to precisely represent seafloor depths on a bathymetric map. On this cruise, the multibeam sonar mapping is helping to map the location of new lava flows, and the resolution is good enough to describe the morphology of those flows, which can be used to extract the volume of lava erupted, the style and the rate of emplacement. For instance, recent mapping in the caldera has allowed a better view of the lava flows erupted there in April 2015. While lights on ROV Jason can show geologists a view of approximately 10 m (32 ft) in front of the vehicle, Jenny’s maps with AUV data reveal high resolution views of much larger areas. |
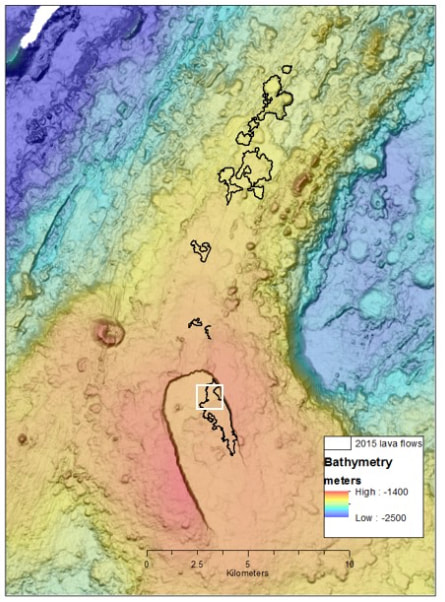
The high resolution multibeam sonar data collected by AUV Sentry allows fine details of new lavas to be resolved in the resulting maps. While ROV Jason can photograph similar features, it cannot access the extensive areas that AUVs can map, so often the AUV maps are used to identify features that merit detailed exploration with ROV Jason. The combination of widespread, high resolution mapping is a critical contribution to the characterization of the distribution of the 2015 lava flows, yet another important step towards understanding this active submarine volcano.
In addition to creating high-resolution bathymetric maps, another goal of the sonar mapping by AUV Sentry is to look for changes in seafloor depth due to deformation related to inflation and deflation since previous surveys were collected. This data will be used to complement the pressure measurements and expand the spatial coverage of the deformation measurements in the future.
Images courtesy of the 2015 Axial Team.
Related Oceanscape Features:
|

|

|
|
Downloadable Items:
|