
|
Navigate:VIRTUAL EXPLORATIONS > ARCHIVED EXPLORATIONS > AXIAL SEAMOUNT ERUPTION RESPONSE
|
Part 12: Pressure DiveGuest Contributor: Rachel Teasdale
Posted August 22, 2015: Today we started the Pressure Dive — this is a 3 and a half day campaign in which ROV Jason will visit 10 sites in a circuit that will be completed three times. The depth to the seafloor can be extracted from the water pressure of the overlying water column. At the surface, atmospheric pressure is 14.5 psi (pounds per square inch) and that increases by an additional 14.5 psi every 33 feet (10 m) of water depth. Bill Chadwick and Scott Nooner use the water pressure on the seafloor to determine the precise depth of the seafloor at an array of seafloor monuments and then they look for changes in the depth of the monitored sites over time. This is important for understanding whether magma is welling up in the volcano, a process known as inflation, or if magma is moving out of the volcano, known as deflation. Prior to the April 2015 eruption, the caldera gradually inflated at a rate of 2 feet per year (60 cm/yr) for several years, and then deflated suddenly by 8 feet (2.4 m) over just a few days during the eruption. 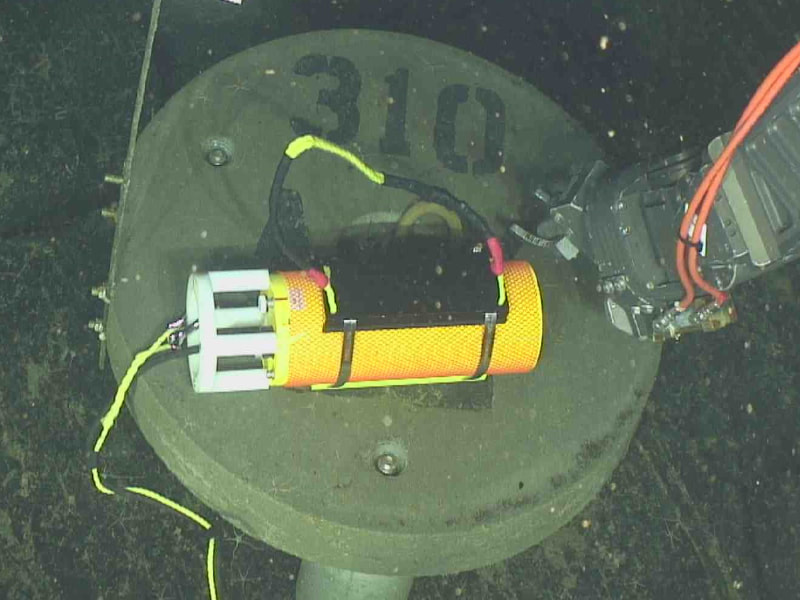
One of the pressure instruments positioned on the ocean floor.
|
Pressure measurements are made at nine sites in and around the caldera. A tenth site (AX-105) is located approximately 6 miles (10 km) south of the center of the caldera and is assumed to be stable and serves as a reference site. During the pressure dive, the depth of the 9 monitoring sites in the caldera is precisely determined relative to the reference site.
Three instruments are involved in monitoring the “bottom pressure” to help Bill and Scott accurately detect vertical movements of the volcano. The pressure at the ten sites will be measured for 20 minutes per visit, during each of three circuits by ROV Jason’s “Mobile Pressure Recorder” (MPR). Repeated measurements during the three circuits help to reduce errors in the measurements. Pressure sensors are more stable when kept at depth, so ROV Jason (and the ship) will move back and forth between each site, rather than bringing the ROV (with the pressure sensor) up and down between sites.
A second way to measure pressure is with Bottom Pressure Recorders (BPR), which record continuously and are installed at multiple sites in the caldera and remain on the seafloor for years at a time. These battery-operated BPRs are attached to moorings with weights attached that are deployed by dropping them from the surface and letting them sink to the seafloor. When it is time to recover the BPR, an acoustic signal can be transmitted to trigger the release of the anchor, which allows the BPR and its flotation to rise back to the surface where they are retrieved by the ship. Data is downloaded from the BPRs and they are redeployed to continue the long-term measurements. Six of the ten MPR sites on the pressure dive circuit have not previously had BPRs installed, so mini-pressure recorders will be placed on the MPR benchmarks during our 2015 campaign. The mini-pressure recorders will measure pressure for approximately two years until retrieved by a submersible during a future expedition.
A third set of BPRs are part of the Ocean Observatories Initiative Cabled Array, which were installed in a network of instruments in 2014 by the University of Washington. These BPRs are cabled for power and data transmission between Axial Seamount and the Oregon coast.
Axial Seamount is also a test site for instruments under development, such as the Self-Calibration Pressure Recorder (SCPR) that Glenn Sasagawa and his colleagues at Scripps Institution of Oceanography at UC San Diego have developed to eliminate drift issues with pressure recorders. Glenn is looking forward to Sunday August 23rd when he plans to retrieve and download data from the experimental SCPR that was installed in the caldera during the previous ROV Jason pressure dive in 2013.
The suite of pressure recorders are used collectively because the measurements of each can be compared to each other and have different strengths. The BPRs collect data continuously but the pressure sensors have a tendency to drift mechanically at a rate similar to the annual uplift of the caldera during non-eruptive stages. Data collected in the MPR campaign are used to compare and correct the BPR drift but are collected only during expeditions with submersibles like ROV Jason, so are expensive and infrequent. Measurements from the cabled network provide real-time data but are currently only available at three sites in the caldera and will not operate if power or communication is interrupted.
Use of multiple data sets that are collected at a variety of sites around the summit of the volcano provides the best possible data to help Bill, Scott, Glenn and numerous colleagues understand how the volcano inflates and deflates in response to magma supplied from below. These movements give information about how much magma is moving in or out of the volcano, how eruptions are triggered, and also can be used to forecast when the volcano is ready to erupt again.
Photos and video courtesy of the 2015 Axial Team.
Related Oceanscape Features:

|

|

|
|
Downloadable Items:
|